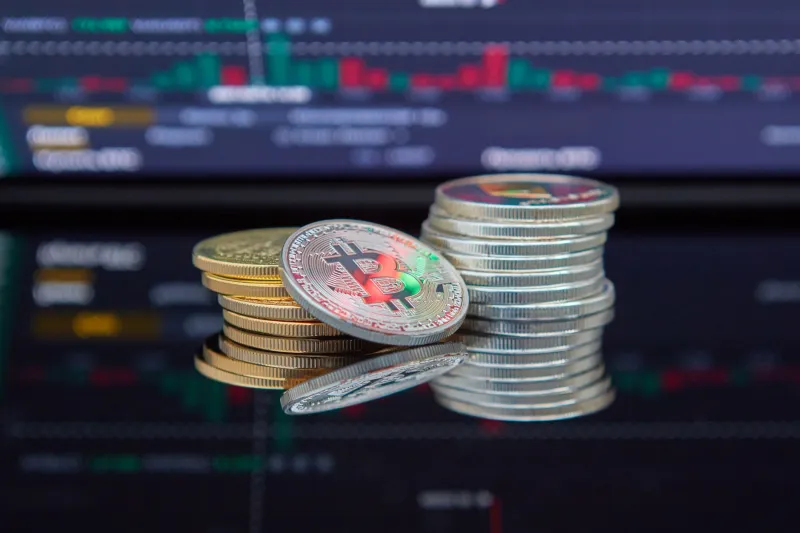
Your Pre-Game Checklist: 6 On-Chain Signals Crypto Bettors Can't Afford to Ignore

Your Pre-Game Checklist: 6 On-Chain Signals Crypto Bettors Can't Afford to Ignore
Every serious sports bettor knows the drill: before you put money on a game, you check the injury report, the weather, the line movement, the public betting percentages. You don't just look at the standings and fire away. The same discipline applies to crypto — except instead of beat reporters and injury designations, your edge comes from the blockchain itself.
On-chain data is the raw, unfiltered record of everything happening on a given network. Wallet movements, exchange activity, gas fees, stablecoin flows — it's all publicly visible, timestamped, and brutally honest. No spin, no PR, no analyst bias. And for crypto bettors and traders who know how to read it, this data can be the difference between a well-timed entry and getting caught on the wrong side of a major move.
Here are six on-chain metrics you should be checking before you place any significant wager or trade — plus the tools to pull the data without needing a computer science degree.
1. Exchange Inflows: The "Uh-Oh" Signal
When large amounts of a cryptocurrency start flowing into centralized exchanges, that's typically a sign that holders are preparing to sell. Moving coins from a cold wallet or DeFi protocol to Coinbase or Binance is a deliberate action — people don't do it for fun. They do it because they want liquidity to offload.
Real example: In the weeks before several major Bitcoin corrections over the past few years, on-chain analysts flagged significant spikes in BTC exchange inflows. Those who caught the signal early had the chance to reduce exposure or hedge before the sell pressure hit.
Conversely, sustained outflows from exchanges — coins moving to self-custody — suggest holders are accumulating and not planning to sell anytime soon. That's a bullish structural signal.
Tool to use: Glassnode's Exchange Net Position Change chart is one of the cleanest ways to visualize this. CryptoQuant also offers solid exchange flow data with US-friendly dashboards.
2. Whale Wallet Activity: Follow the Big Money
In sports betting, when the sharp money moves a line, you pay attention. In crypto, whale wallets — addresses holding enormous quantities of a token — are your sharp bettors. When wallets with 1,000+ BTC or millions in ETH start moving funds, the market tends to follow.
This doesn't mean blindly copying whale behavior. Whales can be wrong, and they sometimes create false signals intentionally. But clusters of whale activity — multiple large wallets all moving in the same direction within a short window — are harder to dismiss.
Tool to use: Nansen is the gold standard here. It labels wallets based on historical behavior ("smart money," exchange wallets, NFT traders, etc.) so you can filter noise from signal. Whale Alert on Twitter/X is a free, real-time alternative for catching large transfers as they happen.
3. Gas Fee Spikes on Ethereum: The Crowd Is Moving
Gas fees on the Ethereum network are essentially a real-time congestion meter. When fees spike dramatically, it means a massive number of transactions are competing for block space — people are rushing to do something on-chain in a hurry.
Historically, extreme gas spikes have coincided with panic selling events, NFT mint frenzies, DeFi liquidation cascades, and major airdrop claims. Each of those scenarios has distinct implications for price action and market sentiment.
Real example: During the DeFi summer of 2020 and the NFT boom of early 2021, gas fees hit all-time highs as retail activity surged. For traders watching on-chain data, those spikes were a flashing sign of peak retail enthusiasm — a classic contrarian signal to consider trimming positions.
Tool to use: Etherscan's Gas Tracker is free and updates in real time. For historical context, Glassnode's mean gas price charts let you compare current activity to prior peaks.
4. Stablecoin Supply and Exchange Reserves: Dry Powder Watching
Stablecoins sitting on exchanges are essentially cash on the sidelines, waiting to be deployed into the market. When stablecoin reserves on exchanges increase, it means buyers are loading up and preparing to enter positions. That's bullish pressure building in the background.
Conversely, a sharp drop in exchange stablecoin reserves can indicate that buying power has already been deployed — meaning the fuel for a rally may be running low.
Think of it like this: stablecoin supply is the pregame warmup. You want to see the gym filling up before you bet on a big crowd showing up.
Tool to use: CryptoQuant's Stablecoin Supply Ratio (SSR) is particularly useful — it compares Bitcoin's market cap to the total stablecoin supply to gauge relative buying power. Glassnode also tracks stablecoin exchange reserves across major assets.
5. Active Addresses and Network Usage: Is Anyone Actually Here?
Price can move on speculation alone, but sustained price moves require actual network usage. The number of unique active addresses on a blockchain over a 24-hour period is a proxy for genuine adoption and engagement.
When active addresses trend upward alongside price, you have confirmation that real users are driving activity — not just leveraged futures traders inflating a move. When price rises but active addresses stay flat or decline, that divergence is a yellow flag worth noting.
Real example: Periods where Ethereum's active address count declined sharply while price held relatively steady often preceded significant corrections, as the underlying network activity failed to justify the valuation.
Tool to use: Glassnode and IntoTheBlock both offer active address tracking for major chains. Messari's on-chain data section is another US-friendly resource with clean visualizations.
6. Long/Short Liquidation Maps: Know Where the Pain Is
This one is a bit different from the others — it's derived from derivatives data rather than raw blockchain activity, but it's too valuable to leave off this list. Liquidation heatmaps show the price levels where leveraged long and short positions would be forcibly closed if the market moved to those levels.
Experienced traders know that markets have a tendency to "hunt" liquidity — meaning price often gravitates toward clusters of liquidations before reversing. Understanding where those clusters sit gives you a clearer picture of likely near-term price targets and potential reversal zones.
Tool to use: Coinglass (formerly Bybt) offers some of the best liquidation heatmap data available for free. It's become a staple for active traders in the US crypto community.
Put It All Together Before You Pull the Trigger
No single metric tells the whole story. The real skill — and the real edge — comes from learning to read multiple signals simultaneously and identifying when several of them are pointing in the same direction. Exchange inflows rising while whale wallets are moving while gas fees spike? That's a convergence worth acting on.
This is exactly how sharp bettors approach a big game: they don't bet on gut feeling. They stack information, look for alignment across multiple data sources, and only commit when the picture is clear enough to justify the risk.
The blockchain records everything. It's all there, publicly available, waiting to be read. The only question is whether you're going to check the injury report before you bet — or just hope for the best.